Dateiliste
Aus DGL Wiki
Diese Spezialseite listet alle hochgeladenen Dateien auf.
| Datum | Name | Vorschaubild | Größe | Beschreibung | Versionen |
|---|---|---|---|---|---|
| 18:04, 17. Jun. 2006 | KurvenlaengenInterpolation.gif (Datei) | 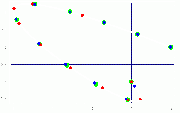 |
6 KB | Vergleich Kurvenlängeninterpolation und Interpolation über die Zeit. Rot: Die Punkte zu den Zeitpunkten 0.0, 0.1, 0.2, ..., 0.9, 1.0 Blau: Die Punkte zu denen 0%, 10%, 20%, ..., 90%, 100% des Weges zurück gelegt wurde angenähert durch FindValue(...) | 1 |
| 07:14, 21. Mai 2006 | GL POINT SMOOTH aktiviert.png (Datei) |  |
1.019 Bytes | 4-Fach Vergrößerung | 1 |
| 07:13, 21. Mai 2006 | GL POINT SMOOTH deaktiviert.png (Datei) |  |
923 Bytes | 4-Fach Vergrößerung | 1 |
| 07:13, 21. Mai 2006 | GL LINE SMOOTH deaktiviert.png (Datei) |  |
492 Bytes | 4-Fach Vergrößerung | 2 |
| 07:12, 21. Mai 2006 | GL LINE SMOOTH aktiviert.png (Datei) |  |
599 Bytes | 2 | |
| 04:35, 21. Mai 2006 | FurstumKollision.GIF (Datei) | 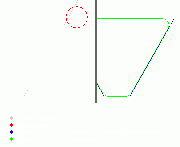 |
4 KB | Kollisionsabfrage einer Kugel mit der Viewfrustum und Problemfall dabei. Und Vergleich zwischen exakter und pessimistischer Kollisionsabfrage. | 1 |
| 05:40, 5. Nov. 2005 | InterpolationCosAnnaeherung.png (Datei) | 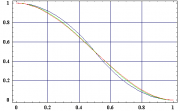 |
2 KB | Cosinus-Interplation Annäherungen. Mathematica Code für diese Grafik: E1 = 1 - t^2*2 E2 = (1 - t)^2*2 S1 = Plot[ E1, {t, 0, 0.5}, Frame -> True, GridLines -> Automatic, PlotStyle -> RGBColor[0, 0, 1]] S2 = Plot[ E2, {t, 0.5, 1}, Frame -> True, | 1 |
| 00:56, 5. Nov. 2005 | InterpolationBsp3.PNG (Datei) | 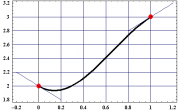 |
3 KB | Beispiel für Interpolation mit gegebenen Tangenten (und natürlich Punkten). Mathematica Code für diese Grafik: E1 = t^3*(-2) + t^2*4 + t*(-1) + 2 S1 = Plot[ E1, {t, 0, 1}, Frame -> True, GridLines -> Automatic, PlotStyle -> Thickness[0.01]] S2 | 1 |
| 00:54, 5. Nov. 2005 | InterpolationBsp2.png (Datei) | 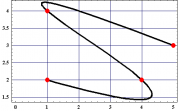 |
3 KB | Beispiel für Polynominterpolation. Mathematica Code für diese Grafik: E1 = -58.5*t^3 + 90*t^2 - 35.5*t + 5 E2 = 22.5*t^3 - 36*t^2 + 12.5*t + 3 S1 = ParametricPlot[{E1, E2}, {t, 0, 1}, Frame -> True, GridLines -> Automatic, PlotStyle -> Thicknes | 1 |
| 00:53, 5. Nov. 2005 | InterpolationBsp1.png (Datei) | 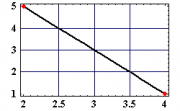 |
1 KB | Beispiel für Lineare Interpolation. Mathematica Code für diese Grafik: E1 = t*2 + 2 E2 = -4*t + 5 S1 = ParametricPlot[{E1, E2}, {t, 0, 1}, Frame -> True, GridLines -> Automatic, PlotStyle -> Thickness[0.01]] S2 = ListPlot[{{2, 5}, {4, 1}}, | 1 |
| 03:52, 24. Mär. 2005 | TexturkoordinateNearestClamp.PNG (Datei) | 3 KB | 2 | ||
| 03:12, 24. Mär. 2005 | TexturkoordinateNearestRepeat.PNG (Datei) | 4 KB | 1 | ||
| 03:12, 24. Mär. 2005 | TexturkoordinateLinearRepeat.JPG (Datei) | 11 KB | 1 | ||
| 03:12, 24. Mär. 2005 | TexturkoordinateLinearClamp.PNG (Datei) | 8 KB | 1 | ||
| 09:11, 8. Nov. 2004 | DistanceBasedBlending.JPG (Datei) |  |
6 KB | Distance based Blending in Outdoor | 3 |
| 07:54, 7. Nov. 2004 | LSystemBaum.png (Datei) | 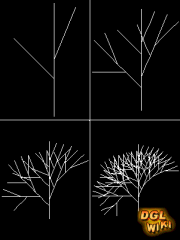 |
6 KB | Baum mit L-Systems | 1 |
| 07:53, 7. Nov. 2004 | SpeedTrees.jpg (Datei) | 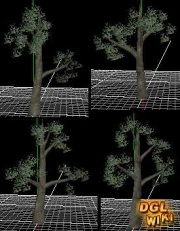 |
19 KB | 1 | |
| 01:28, 28. Okt. 2004 | PerlinPersistenz.png (Datei) | 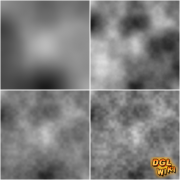 |
67 KB | 2D-Perlin Noise, unterschiedliche Persistenzen | 1 |
| 01:28, 28. Okt. 2004 | PerlinTiefe.png (Datei) | 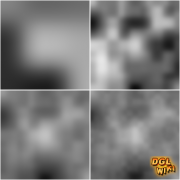 |
48 KB | 2D-Perlin Noise, unterschiedliche Rechentiefen | 1 |
| 01:27, 28. Okt. 2004 | PerlinUeberlagerung.png (Datei) | 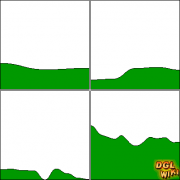 |
3 KB | 1 | |
| 10:40, 7. Okt. 2004 | Verbindungen GeometricalMipmapping.PNG (Datei) | 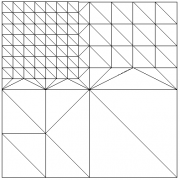 |
4 KB | Verbindungen von Patches beim Geometrical Mipmapping | 1 |
| 10:21, 7. Okt. 2004 | LODStufen GeometricalMipmapping.png (Datei) | 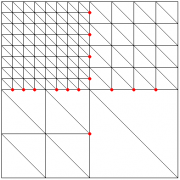 |
3 KB | LOD-Stufen beim Geometrical Mipmapping | 1 |
| 18:31, 26. Sep. 2004 | FragmentPipeline.png (Datei) |  |
20 KB | Fragment Pipeline von OpenGL Version 1.1 | 1 |
| 06:45, 26. Sep. 2004 | VertexPipeline.GIF (Datei) |  |
11 KB | Die Vertex Pipeline von OpenGL Version 1.1 | 1 |